Validating New Relic with Tsung. Or Maybe Not.
por Marcio Marchini
Postado em 25/02/2013

Profiling web apps became easier with New Relic, but sometimes the numbers just don’t add up. Finding consistency can be a challenge, and this post explains one such attempt.
The app to profile: ping
Let’s use a simple app1. All it has is a ping URL, which returns the timestamp as a JSON:
@route('/ping')
def ping():
    return {"time": datetime.datetime.utcnow().isoformat()}
You could use an alternative framework ( CherryPy etc), put it behind wsgi and so on. It is worth doing all these combinations to see your impact in performance. Also, we suggest you compare Cloud providers: Heroku, Beanstalk, GAE, etc.
Simulating many users: tsung
We are going to use tsung to simulate many simultaneous users. Being implemented in Erlang, tsung is capable of simulating many requests from a single machine. We are going to run the experiments with a time limit of 20 minutes. We define various phases, each lasting one minute. Each phase has a different probability of generating synthetic users (double the previous). This is the relevant XML:
  <load duration="20" unit="minute"> <!-- try double of total time of all phases as a cap. this forces the test to stop even if new users still have been generated -->
      <arrivalphase phase="1" duration="60" unit="second"> <!-- pass -w 60 to tsung to match the warm-up here -->
          <users interarrival="1" unit="second"></users>
      </arrivalphase>
      <arrivalphase phase="2" duration="1" unit="minute">
          <users interarrival="0.1" unit="second"></users> <!-- 600 users total -->
      </arrivalphase>
      <arrivalphase phase="3" duration="1" unit="minute">
          <users interarrival="0.05" unit="second"></users> <!-- 1200 + 600 users total -->
      </arrivalphase>
      <arrivalphase phase="4" duration="1" unit="minute">
          <users interarrival="0.025" unit="second"></users> <!-- 2400 + 1200 + 600 users total -->
      </arrivalphase>
      <arrivalphase phase="5" duration="1" unit="minute">
          <users interarrival="0.0125" unit="second"></users> <!-- 4800 +  2400 + 1200 + 600 users total -->
      </arrivalphase>
      <arrivalphase phase="6" duration="1" unit="minute">
          <users interarrival="0.00625" unit="second"></users> <!-- 9600 + 4800 +  2400 + 1200 + 600 users total -->
      </arrivalphase>
      <arrivalphase phase="7" duration="1" unit="minute">
          <users interarrival="0.003125" unit="second"></users> <!-- 19200 + 9600 + 4800 +  2400 + 1200 + 600 users total -->
      </arrivalphase>
      <arrivalphase phase="8" duration="1" unit="minute">
          <users interarrival="0.0015625" unit="second"></users> <!-- 38400 + 19200 + 9600 + 4800 +  2400 + 1200 + 600 users total -->
      </arrivalphase>
      <arrivalphase phase="9" duration="1" unit="minute">
          <users interarrival="0.00078125" unit="second"></users> <!-- 76800 + 38400 + 19200 + 9600 + 4800 +  2400 + 1200 + 600 = 153K users total / will be truncated by maxusers  -->
      </arrivalphase>
  </load>
New Relic Results
If you are running a New Relic version prior to 2013-02-22, you might see results like this:
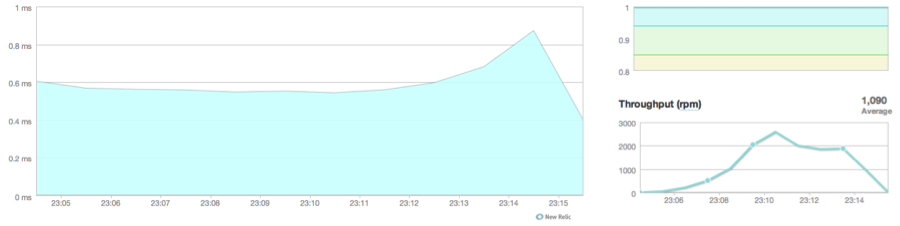
This would probably make you quite happy with the performance of your web app (in Python) in this case, having response times below 1 millisecond.
However, what the numbers above don’t show you is how long the request was queued between the cloud infrastructure and your web app. For example, it is possible that you have a High Availability proxy handling the load and only then forwarding the request to your app. You could be completely in the dark chasing the wrong numbers, as observed in this post.
With a patched New Relic, you can see your Cloud queuing in action more easily. Our previous ping results now look like this:
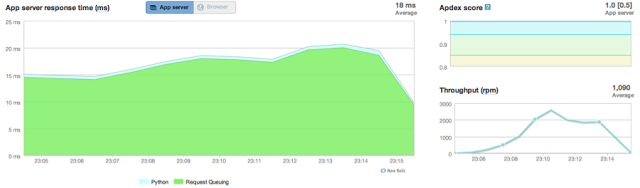
As you can see, all your optimization tricks for performance (uwsgi etc) are being eaten by your Cloud provider’s queuing mechanism / overhead.
Now, this patched New Relic is based on an HTTP header that is inserted by your Cloud Provider. It can be trusted as long as the Cloud Provider can be trusted, I suppose. Can we validate these results? Also – perhaps more importantly - are the clients really getting replies within 20 milliseconds?
Note that New Relic shows you a scenario from a server’s point of view. It does not show what your clients are really experiencing.
Numbers and Graphs from tsung
Looking at the tsung’s Main Statistics, we can see an interesting story:
| Name | highest 10sec mean | lowest 10sec mean | Highest Rate | Mean | Count |
|---|---|---|---|---|---|
| connect | 76.17 msec | 1.81 msec | 145.6 / sec | 18.09 msec | 26335 |
| page | 0.19 sec | 19.64 msec | 145.9 / sec | 93.15 msec | 26335 |
| request | 0.19 sec | 19.64 msec | 145.9 / sec | 93.15 msec | 26335 |
| session | 0.22 sec | 21.36 msec | 146.8 / sec | 0.10 sec | 26335 |
Although there were times when the whole session lasted 21.26 milliseconds in average (lowest 10 sec mean), we can see that at times the numbers were as high as 220 milliseconds (highest 10sec mean). As our site gets a heavier load, all sorts of delays are happening before our app is ultimately invoked. It could be Heroku’s queuing mechanism; it could be uwsgi as our front-end, and so on.
Another interesting tsung graph is “requests and connection establishment”:
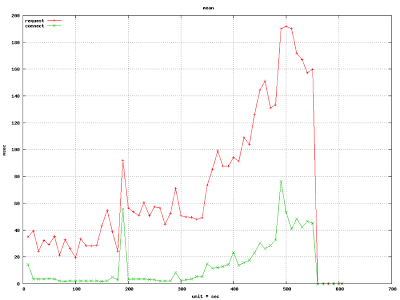
This is a very interesting graph. Note the delta in height between the green line and the red line. The green line is when your Cloud infrastructure accepted the HTTP connect (for example, Heroku’s front-end / queuing). However, the red line shows the true request connection time.
For example, at about t=250s of execution, connection times were about 5 miliseconds, but the request took about 60 milliseconds. That is about 55 miliseconds of extra time going somewhere else. Now, from New Relic we saw that the queue times were about 15ms. That leaves us with about 40ms unaccounted for 2.
Can we trust the tsung numbers? Can we trust the New Relic numbers? Can we trust the Heroku tagging of the HTTP headers?
Things get worse at t=500s. The green line (connect) is at about 50ms whereas the red line (request) is at 190ms. That is a delta of 140ms. Subtract 15ms for the queue time New Relic is showing us, and there are 125ms unaccounted for. In the web world, that is a lot! Where did it go?
Note that delays in the infrastructure IP routing between the client and the server can be blamed on the green line. But once the connection is performed, some high availability proxy must have accepted the connection and now the delay is in the Cloud infrastructure.
It is possible that the server is being overloaded and taking much longer to process the request. But… shouldn’t we be seeing this in New Relic?
It is possible that as our server is taking more simultaneous connections in, Heroku is queuing more requests for us, decreasing the times. But… shouldn’t we be seeing higher queuing times in New Relic?
Maybe the machine is thrashing (paging etc) with so many users? Could be. How can I tell? I’m on Heroku. I do not have New Relic showing me the raw resources.
Conclusion
Don’t trust a single data provider. Cross-check your numbers. Where are my 125ms going? Well… I really don’t know yet. That’s for another post. What numbers do we get under Beanstalk or even Google App Engine? That’s for another post too.
- [1]: We are using Python, with the bottle micro web framework
- [2]: Both tsung and the ping server are inside the Amazon EC2 infrastructure, meaning that TCP connection times are quite fast.
Para conhecer mais sobre Marcio Marchini clique aqui , para ver todos seus Posts clique aqui